Some products developed in AMR can be downloaded here.
Before Download
You must agree to all the descriptions here before downloading any product below.
All products on this page can be used for free, but the authors and/or the National Institute of Radiological Sciences (NIRS), Japan, retain the copyright. Secondary distribution is not permitted. Please inform those with interest in them of the link to this AMR website.
In case you submit any work made with the use of these products to a meeting, congress, or any publication, please cite the products appropriately. Further instructions for such citations are included in the download files (Readme.txt). Please follow them.
Disclaimer
All the products downloadable from this page are developed for research purposes, and are not intended for diagnostic use. The authors and copyright holders make no warranties as to the performance or fitness for any particular purpose, or any other warranties whether expressed or implied. No oral or written communication from or information provided by the authors shall create a warranty. In no circumstances shall the authors and copyright holders be liable for any direct, indirect, incidental, special, exemplary, or consequential damages (including, but not limited to procurement of substitute goods or services; loss of use, data, or profits; or business interruption) however caused, and on any theory of liability, whether in contract, strict liability, or tort (including negligence or otherwise) arising in any way out of the use of the products, even if the authors have been advised of the possibility of such damages.
QDyM (Quantification tool for DCE-MRI)
Applications
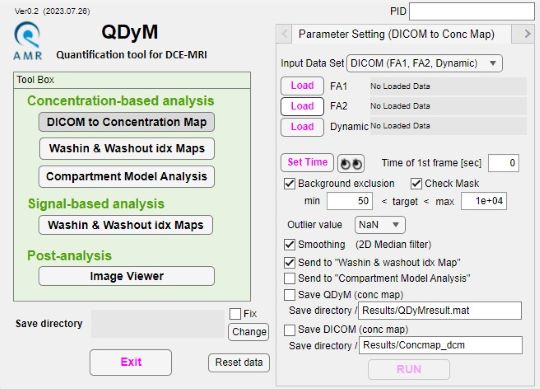
This software is a tool for quantitative analysis of dynamic contrast enhanced T1-weighted MRI (DCE-MRI). This software calculates concentration maps of contrast agent from dynamic series of the DCE-MRI. Sequentially, some semi-quantitative parameters (washin-idx, washout-idx) and quantitative parameters of a compartment model (Ktrans, kep, Ve) are calculated (see figure below), and basic analysis of the parameter map is also provided on the window, such as calculating mean values and displaying time-concentration curves.
This software supports DICOM, NIFTI, and MATLAB file formats for loading and saving data.
本ソフトウェアはダイナミック造影MRI(DCE-MRI)定量解析ツールです。DCE-MRI測定データから造影剤濃度画像への変換と、その後の半定量解析(washin-idx, washout-idx)、コンパートメントモデル定量解析(Ktrans, kep, Ve)を行うことができます(下図参照)。
本ソフトウェアは、入出力データとしてDICOM、NIFTI、MATLAB fileフォーマットをサポートしています。
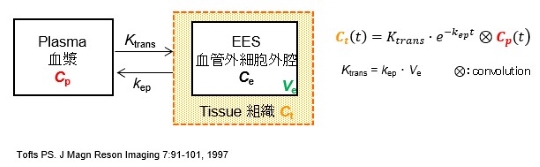
*** Compartment Model Analysis ***
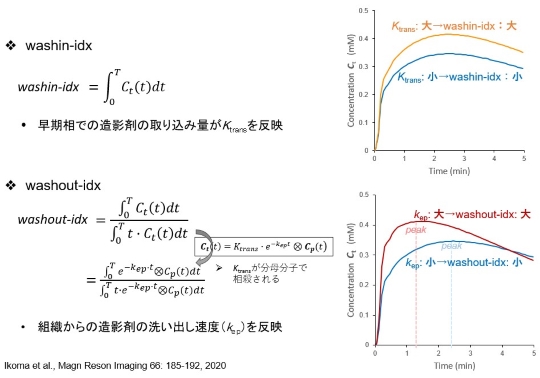
*** Semi-quantitative Analysis (washin-idx & washout-idx) ***
[Operation checked on Windows 11 64bit.]
Recent update: 19 Sep 2023.
eDKI calculator
(estimated Diffusional-Kurtosis Imaging)
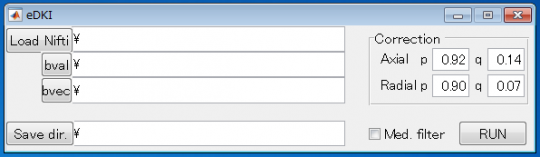
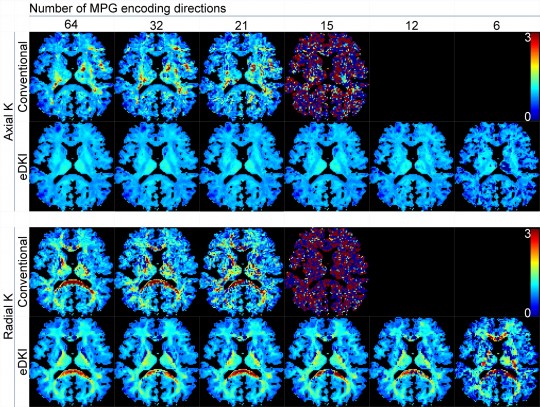
This software robustly calculates the estimated map images of diffusional-kurtosis imaging (DKI) for "axial" and "radial" directions of each voxel. In CNS, the axial and radial directions correspond to the directions parallel and perpendicular to the neuron fibers. The estimated maps are dramatically less noisy compared to those obtained by conventional method, especially when the number of diffusion encoding direction is small. They are not the exact original DKI images, but the accuracy of the estimation is considerable (see the sample images).
The raw diffusion-weighted imaging (DWI) data must include more than 3 different b-values, including zero, and 6 or more diffusion encoding directions at each b-value (more than 15 directions are recommended). Please download and see the readme file for further information.
[Operation checked on Windows 7 64bit. CPU: any Intel or AMD x86 processor supporting SSE2 instruction set; RAM 1024MB (at least 2048MB recommended). ]
Recent update: 27 Apr 2015.
Monte-Carlo-simulator-for-DWI code
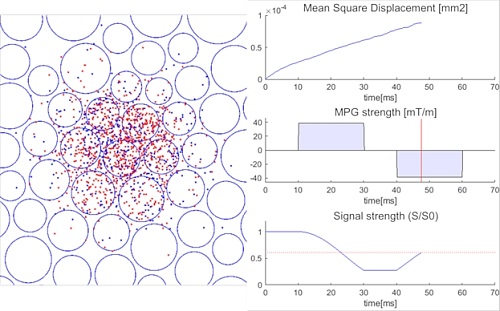
This MATLAB code enables Monte Carlo simulation of the MR diffusion-weighted imaging sequences. The field to be simulated consist of arbitrary organized circles (2D mode) or cylinders (3D mode) that represent the borders of the cells or neuron fibers that works as obstacles, and the randomly moving dots that represent the Brownian motion of the water molecules. Motion probing gradients (MPG) can be applied to any direction and strength at each unit time (e.g. 0.1usec), and the resulting de-phase and re-phrase of the molecules can be visualized in real-time.
This simulator is included to the qMRIlab project (https://qmrlab.org/) [Karakuzu A. et al, ISMRM2019].
[Operation was checked on MATLAB R2019b with optimization toolbox, Windows 10 64 bit, version 1903. (Optimization toolbox is not necessary, but strongly recommended)]
Recent update: 13 May 2020.